
Independent Financial Research & Analysis
Daily briefings, 7,600+ real-time charts, and macro insights from Dr. Ed Yardeni and his research team.

Research
Latest Research
Recent insights from our research team
Warsh World
Fed Chair Kevin Warsh isn’t one to give the markets a heads-up. Investors are trying to translate what he says into what he would like the Fed to do. To that end, Ed and Elias parse Warsh’s remarks last week at the Jackson Hole symposium. While Warsh’s assessment of economic conditions is hawkish, is it just hawkish squawk or indicative of his vote at September’s FOMC meeting? Whether he backs raising or maintaining the current federal funds rate may hinge on whether August inflation data suggest persistent weakness. But Warsh’s Jackson Hole comments did give the FOMC’s hawks some support and did shed some light on his policy approach.
US SECTORS CALL: Information Technology, Energy & Consumer Discretionary
Information Technology (MW) led the S&P 500 sectors last week, up 1.8%. The sector rose 3.4% on Thursday following Nvidia’s results the previous evening. Nvidia guided to 70% revenue growth next fiscal year against a 45% consensus. Energy (OW) was among the weakest, down 2.0%, while Consumer Discretionary (UW) rose 0.1%. The rate-sensitive sectors sold off on Friday after Warsh’s Jackson Hole speech, with Real Estate (UW) down 1.3% on the week and Utilities (OW) down 4.0% on the month (chart). Here's more on Software, Energy, and Consumer Discretionary: (1) Software: Cyber and SaaS soar. Dr. Ed said on CNBC on February 26 that the market had overdone AI's potential negative impact on software stocks. The iShares Expanded Tech-Software ETF closed at $82.60 that day. It closed Friday at $109.50, up 32.6% since then (chart). Markets initially priced software as a sector vulnerable to AI disruption, yet it is proving to be the essential distribution layer for AI integration. CrowdStrike reported earnings on Wednesday evening, with revenues up 26% y/y and raised guidance. The stock rose 20.50% on Thursday. Salesforce reported the same evening, with revenues up 11% y/y and annual recurring revenue from Agentforce and Data 360 up more than 210% to nearly $3.9 billion. It raised full-year revenue guidance and rose 22.58%. Cybersecurity has led all year. Palo Alto Networks and CrowdStrike are the two best performers among the IGV names, while AppLovin, Intuit, and Oracle all have fallen more than 20% (chart). Agentic AI has widened the attack surface faster than enterprises can defend it, and security budgets are being written against that gap. Application Software remains among the weakest industries in the Information Technology sector, down 9.4% ytd, alongside IT Consulting & Other Services at -24.5%. Systems Software is up 10.1%, behind the sector's 22.1% (chart). Most of the recovery has come within the past month. Application Software has a 30.5% forward profit margin, with earnings forecast to grow 20.0% this year and 15.7% next (chart). It trades at 23.0 times forward earnings against 21.3 for the sector, and down from 26.5 at the end of 2025. We remain at a market weight rating on Information Technology. (2) Energy: The war trade cools. Diplomatic efforts to reopen the Strait of Hormuz, restored Gulf shipments, and a surprise build in US crude inventories all weighed on the oil price this week. Both benchmarks fell more than 3% on the week, with Brent closing at $88.29 and WTI at $83.44. Energy fell 2%, the worst of the 11 sectors after leading them last week, though it is still the best ytd at 38.5%. The producers took the damage. Integrated Oil & Gas fell 3.8% and Exploration & Production fell 3.6%, while Oil & Gas Storage & Transportation along with Refining & Marketing rose 1.3% (chart). The earnings are outrunning the revenues. Forward earnings per share is up 56.3% y/y against forward revenues per share up 18.2% (chart). The forward profit margin has risen from 8.3% at the start of the year to 11.7%. The sector earns more than its weight. Energy accounts for 3.4% of the S&P 500's market capitalization against 4.8% of its forward earnings, and trades at 13.8 times forward earnings, the cheapest of the 11 sectors. We retain our overweight rating on the energy sector. (3) Consumer Discretionary: Cheaper for a reason. Consumer Discretionary has lagged all year, and Dick's Sporting Goods showed why on Tuesday. The stock fell 31% after missing on earnings. Adjusted earnings per share fell 19% y/y, management cut its full-year guidance, and Foot Locker’s comparable-store sales fell 3.6% on a pro forma basis. The brands have fared no better. Nike and Lululemon are both more than 75% below their record highs. The weakness is concentrated. Footwear is down 34.1% ytd, and Other Specialty Retail is down 22.5%, while Broadline Retail is up 15.5% (chart). Broadline Retail's forward profit margin is 13.6%, up a lot from 3.5% in March 2023. Amazon and Tesla together account for 43.4% of the sector's forward earnings and 58.7% of its market capitalization (chart). The sector's fortunes track those two more than consumer spending. The multiple has come down, but not far enough. At 24.0 times forward earnings, down from 29.1 at the end of 2025, the sector still trades at a 22% premium to the S&P 500's 19.7 forward P/E (chart). Yet the consensus long-term earnings growth projection is 17.5%, against 25.0% for the index. We are retaining our underweight rating on the Consumer Discretionary sector. Amazon is carrying the sector while the brands and specialty retailers that sell to the everyday consumer keep falling.
GLOBAL MARKETS CALL: Bull Market In Stocks Despite Bear Market In Bonds
Bond yields are rising worldwide, but that's not stopping the global bull market in stocks. For now, investors are reading higher yields as a sign of economic growth rather than a threat to it, so the "Go Global" trade is still working. South Korea and Taiwan are back at the top of August's leaderboard after July's shakeout. The AI-linked markets that led all year are leading again. The laggards are markets with domestic problems, not those exposed to the global business cycle. Here's more: I. Global Interest Rates Government bond yields continue to grab headlines. The UK and Australia are both above 5.00%, at 5.15% and 5.09% (chart). The US at 4.73% is toward the upper end of the 4.00%-5.00% range we call the "old normal." Japan and Germany continue to rise, at 2.92% and 3.27%, both up steadily since February. The long end is pricing a policy turn. Official rates are well below market yields across the major economies, with the RBA at 4.35%, the Fed and BoE both at 3.75%, and the ECB deposit rate at 2.25% (chart). Markets have shifted from pricing central bank rate cuts to pricing hikes in the coming months. II. Foreign Exchange Collectively, the three dollar indexes we monitor are showing a slight upward tilt so far this year (chart). The DXY touched a three-month low last week following the Treasury department's intervention in the long end of the Treasuries market. We remain in the constructive camp on the dollar. We aren't buying the de-dollarization story. The dollar has been relatively stable relative to other developed economies over the past year (chart). The dollar has been strengthening relative to emerging markets currencies for several years (chart). III. Global Stock Markets South Korea and Taiwan are back at the head of the pack in the global stock market derby. Korea leads the mtd rankings at 14.7% in dollar terms, and Taiwan is second at 11.8% (chart). EMXC is up 6.5%, versus 4.8% for EEM, 3.1% for ACWX, and 3.0% for SPY (i.e., the US). The three biggest losers were the Philippines (-6.8%), Brazil (-3.0%), and China (-2.7%). Forward revenues per share has been accelerating worldwide (chart). Those of both the All Country World ex-US MSCI in local currency and the US MSCI have been rising more rapidly since late 2025. Forward earnings likewise has been accelerating (chart). Overseas earnings have kept pace with the US, both in dollar terms. IV. Japan Focus The yen is at 159.86 per dollar and has been drifting back toward its pre-intervention level, while the Nasdaq 100 has been moving sideways (chart). The inverse relationship between the two can be explained by the yen carry trade, which hasn't unraveled so far. Technology leads the FTSE Japan sectors ytd at 42.5%, with Financials second at 40.6% (chart). The index is up 20.9%. Real Estate is the only sector down, at -8.2%. V. Brazil Focus Brazil is the far outlier in terms of long bond yields. Its 10-year government bond yield is 14.70%, well above those of Colombia at 12.45% and Mexico at 9.21%, and roughly three times that of the US (chart). Brazil’s 14.70% 10-year bond yield is near the top of its range over the past two decades, exceeded only in 2008 and 2015-16 (chart). Both of those coincided with recessions. The Brazil MSCI local currency index is near a record high, while the comparable dollar index is well below its 2008 peak (chart). Foreign investors have not been paid for two decades of local-currency gains. VI. Sectors Five sectors have triple-digit ytd gains in local currencies (table). Taiwan Basic Materials leads at 169.6%, followed by Hong Kong Technology at 150.5%, Korea Technology at 136.6%, Telecommunications at 113.4%, and Taiwan Health Care at 102.6%. Telecommunications and Energy are the broadest outperformers globally, up 35.0% and 34.4% for the World index.
Archive
Our Research Library
19 years of daily research, charts, and analysis
Topics
QuickTakes Topics
Timely commentary covering the most important market themes
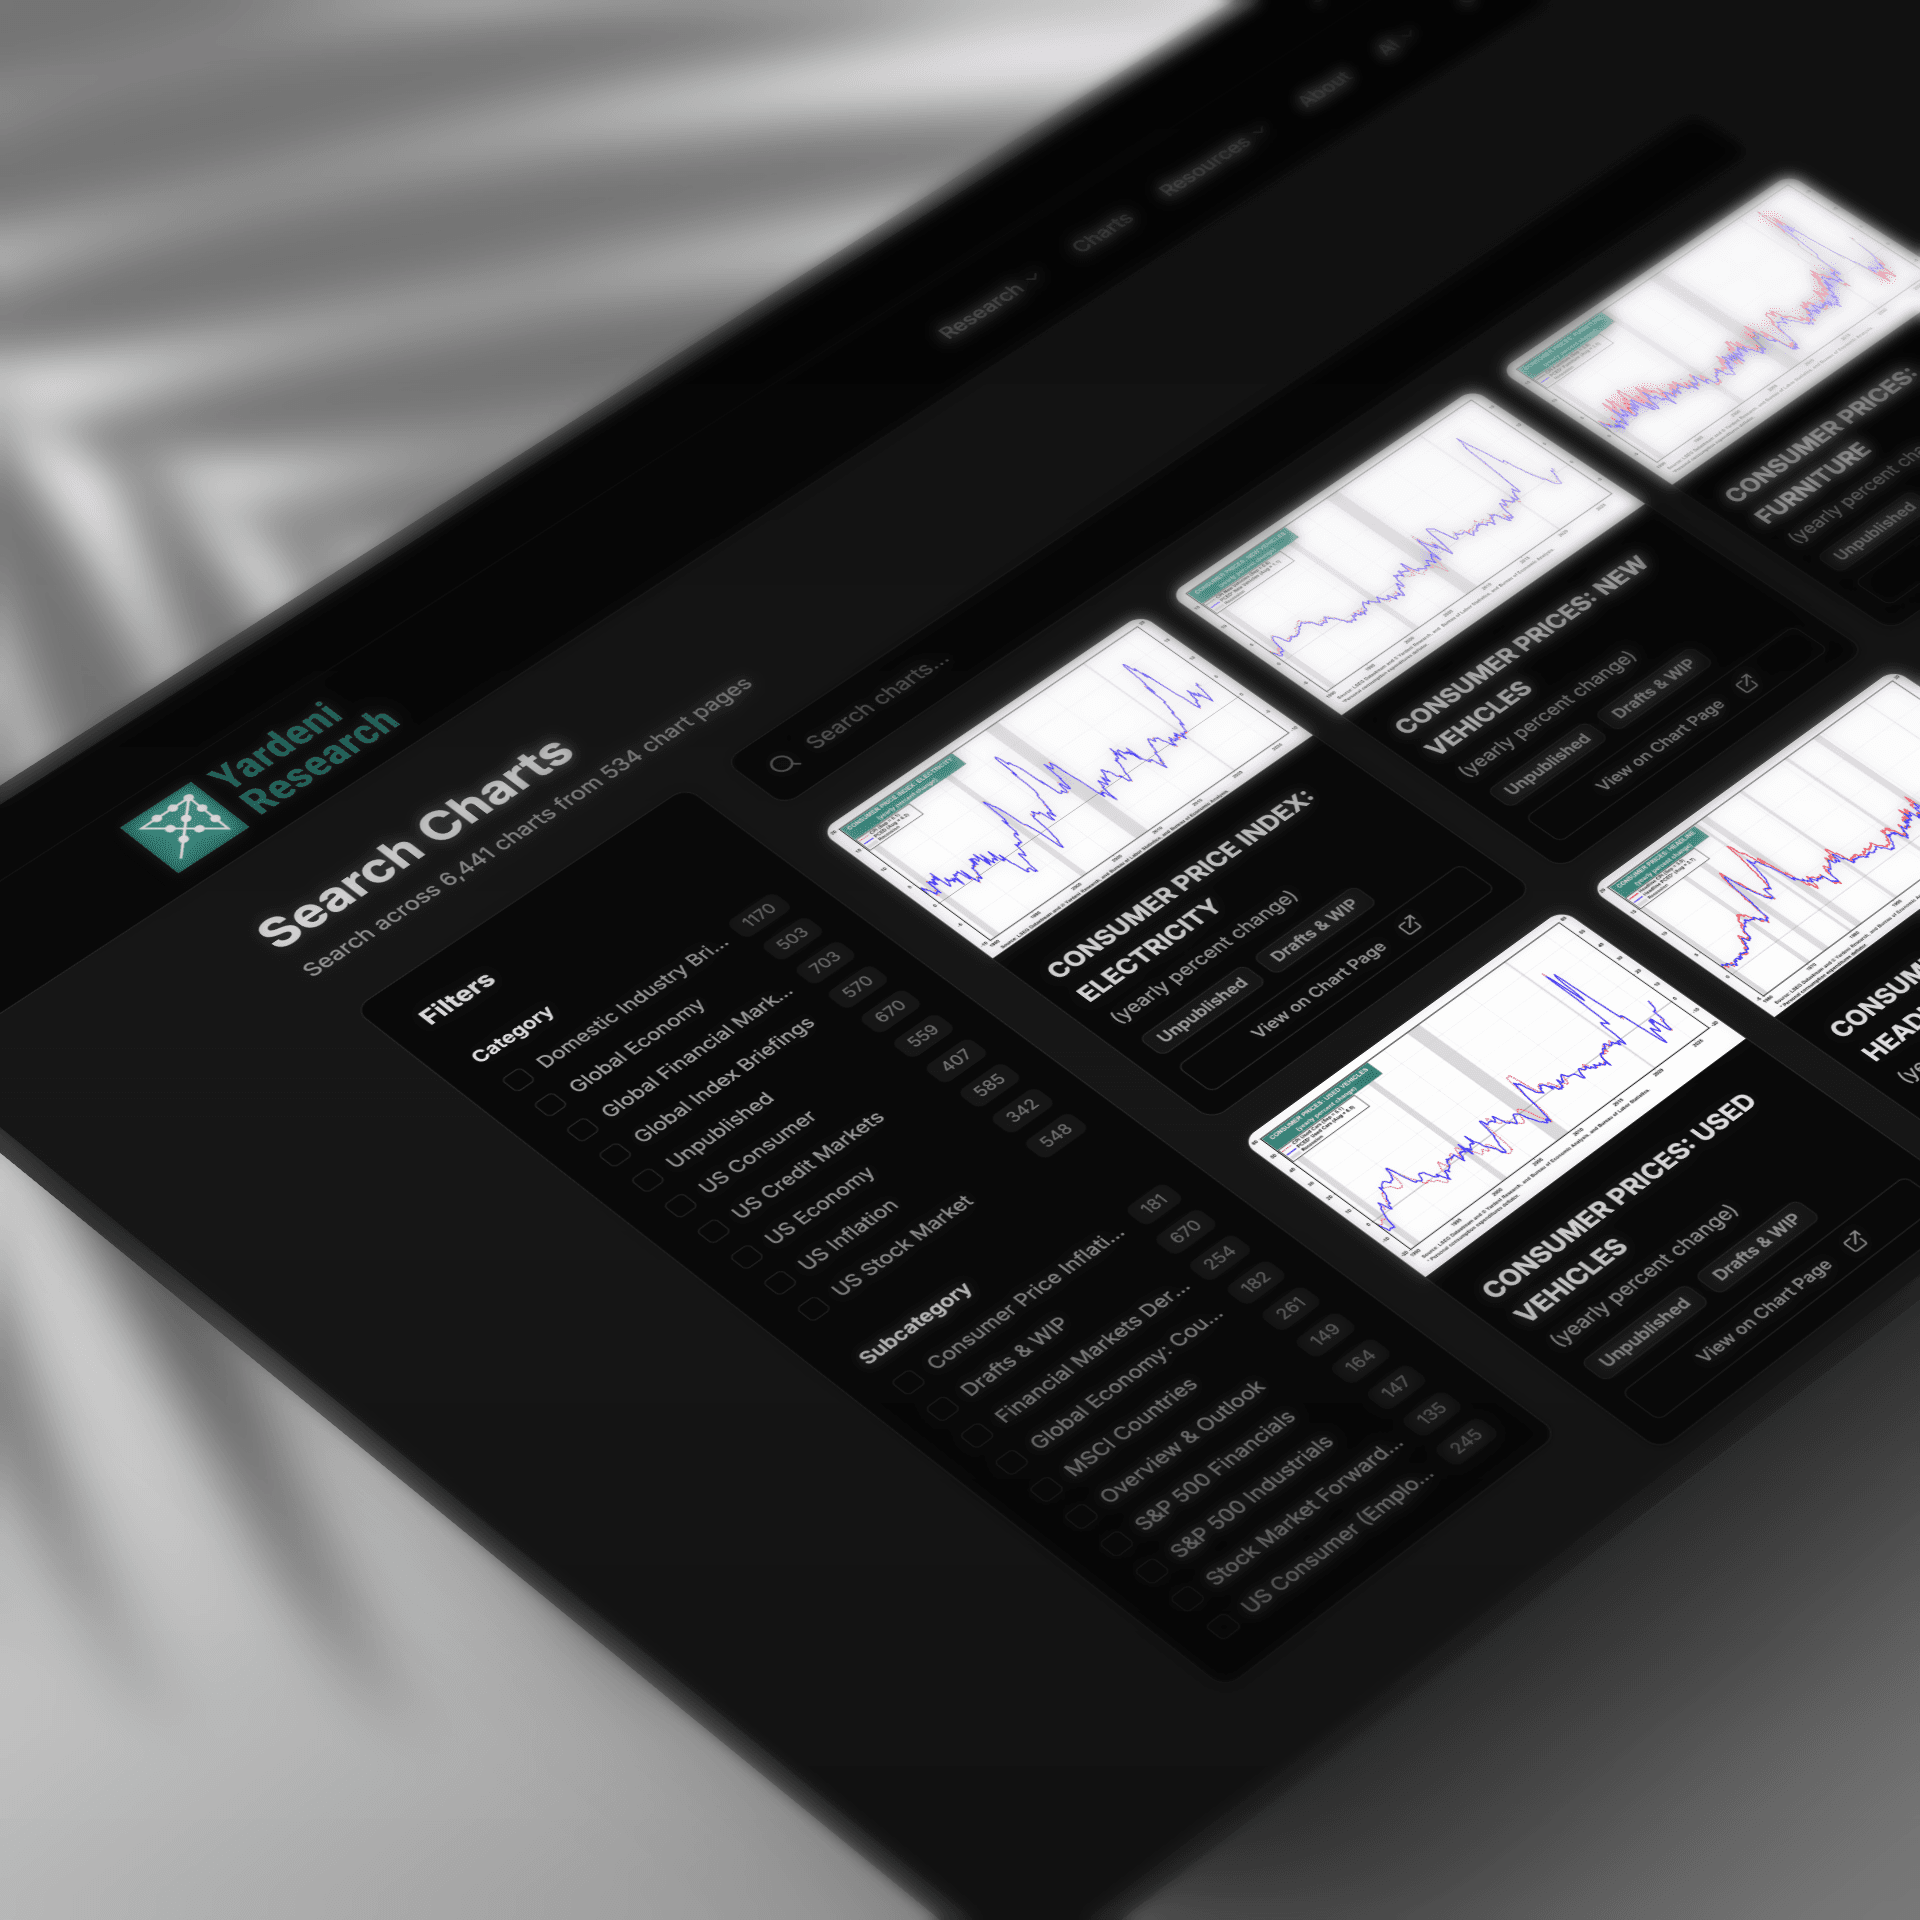
Charts
Find Any Chart in Seconds
Search across 7,618+ real-time charts with instant visual previews
LOWE'S: PRICE, FORWARD EARNINGS & VALUATION
NETFLIX: FORWARD REVENUES
ACCENTURE: FORWARD LTEG, STRG & STEG
S&P 500 SECTORS: ANNUAL EARNING GROWTH FORECAST
Sample charts from our collection of 7,618+ visualizations
Tools
Research Tools
Interactive dashboards for tracking economic conditions and market trends
Beige Book Monitor
Fed economic conditions across 12 districts with traffic-light signals.
FOMC Policy Meter
Dovish-to-hawkish policy stance tracker across FOMC meetings.
FOMC Minutes Monitor
Hawk/dove signal extraction across 10 economic themes.
FOMC SEP Monitor
Fed projections and dot plot distributions across meetings.
FOMC Statements
Every FOMC policy statement since 1997 — full text, rates, and voting records.
Private Credit Monitor
Auto-updating chronology of the private credit liquidity crisis.
Release Calendar
Major publications from the Fed, ECB, IMF, and 12 global institutions.
Try Yardeni Research free for four weeks.
Full access to everything we publish. No credit card, no obligation.