Independent Financial Research & Analysis
Daily briefings, 7,500+ real-time charts, and macro insights from Dr. Ed Yardeni and his research team.

Research
Latest Research
Recent insights from our research team
US MARKET CALL: Situational (Un)Awareness Hedge Fund Blows Up Without Blowing Up The Market
So far, so good. We predicted a summer stall in the stock market, with bouts of volatility rather than a correction, and that is how June and July played out. The S&P 500 has gone nowhere since May 14, fluctuating around 7,500, while the market has churned underneath. The rotation of leadership among sectors that we expected has continued. Breadth has improved. Nothing in the past month has changed our view that the index should reach 8,250 by year-end. The summer stall could last until the start of the fall. On the plus side for investors is Fabulous Earnings Momentum (FEMO). On the negative side for them are ongoing uncertainties about the AI business model, the Middle East war, the persistence of inflation, and the Fed's reaction function under Fed Chair Kevin Warsh. The net result so far has been a flat market with lots of volatility. Such volatility combined with leverage can be fatal. Leopold Aschenbrenner's $45 billion hedge fund, Situational Awareness, blew up last week. He was forced to sell his entire book of public equities to Citadel after losses on his long positions in the AI trade triggered margin calls. This event undoubtedly contributed to last week's volatility, as did Warsh's lame first press conference; yet the S&P 500 rose 1.0% for the week! S&P 500 Semiconductors contributed to the week's downside volatility, falling 3.4% (chart). On July 19, we wrote that the S&P 500 Semiconductors stock price index was likely to fall to its 200-day moving average. Now let's take a deeper dive below the market's calm surface: (1) Breadth. The S&P 500 equal-weight index continues to outpace the market-weight index, with the former up 12.1% ytd versus 9.4% for the latter (chart). The Impressive 493 has beaten both the Magnificent-7 and the S&P 500 by wide margins ytd (chart). The Mag-7 closed the gap a bit in recent days, driven by strong results from Microsoft and Amazon. The Russell 2000 is trading near a record high, up 18.1% ytd (chart). SmallCaps wouldn't be leading if investors thought that a recession is likely. (2) Sentiment. The bull-bear stock market sentiment ratios (BBRs) are mixed. The Investors Intelligence BBR is modestly above its historical average, while the AAII ratio is well below its own (chart). Retail investors are more bearish than institutional investors on balance. On the other hand, according to the Consumer Confidence Index (CCI) survey, the percentage of respondents expecting higher stock prices over the next 12 months, at 52.4% in July, is well above its long-run average of 35.6% (chart). This series reflects a longer forecasting horizon than the BBRs. (3) Valuation. The forward P/E of the S&P 500 is well correlated with the CCI stock market bullishness series (chart). The former is relatively elevated because most investors don't expect a recession anytime soon so do expect stock prices to move higher. The Magnificent-7’s collective forward P/E is down to 22.8. That's partly because Alphabet and Amazon earnings were boosted by mark-to-market (MTM) investment gains (chart). This development also lowered the S&P 500 forward P/E to 19.4. Such gains were not relevant to the S&P 400 and S&P 600, which remain relatively cheap. Comparisons to the 1999 Tech Bubble are looking less and less credible. The S&P 500 Information Technology sector's forward P/E is 20.0, just 0.6 points above the S&P 500's 19.4 (chart). At the 2000 peak, the gap was as wide as 30 points. (4) Earnings. Earnings continue to deliver. Q2 earnings growth of 37.0% y/y was inflated by the MTM gains we flagged last week, but Q3 and Q4 are rising on their own merits, to 22.1% and 26.8% respectively (chart). We are increasingly focused on analysts' consensus earnings-per-share expectations for 2027. It continues to set new highs without any MTM distortion, at $407.72 last week (chart). That estimate is a clean read on FEMO. Forward earnings for the S&P 400 MidCaps and S&P 600 SmallCaps are rising along with the LargeCap forward earnings series (chart). The MidCaps and SmallCaps are not distorted by MTM. (5) Bonds. The Bond Vigilantes are not happy. The 10-year Treasury yield has climbed to its highest level since January 2025 and is near the top of our 4.00%-5.00% "old normal" range, and the inflation-adjusted TIPS yield has risen with it (chart). Expected inflation has stayed contained. Stocks are absorbing higher yields well so far. (6) Commodities. The stock market continues to tune out volatility in crude oil prices (chart). The price of a barrel of Brent crude is currently in the middle of its wide (and wild) range since the war started (chart). Copper is signaling that the global economy is growing and that AI infrastructure demand for the metal remains strong. It is currently pressing the top of its multi-year upward trending channel (chart). The gold price has broken below its channel and is holding just above $4,000 per ounce (chart). We see support at $4,000 and think it will stay above that level. If it does, then $5,000 is still possible by the end of the year. If it does not, then $3,500 is the next level of support. Rare earths have taken a dive on no obvious news (chart). They've fallen faster than precious metals, while base metals remain on an uptrend.
US Economy Is Still Flying
The latest batch of economic data suggests that the US economy remains in remarkably good shape. Domestic demand is strong, and the labor market continues to show resilience. Inflation isn't as picture-perfect. While June's PCED report provided some welcome relief, recent inflation shocks may spread in coming months. They include another round of tariffs, the AI building boom, high energy prices, and supply-chain disruptions. They will likely keep inflation above the Fed's 2% y/y target. Let's review the recent batch of economic indicators: (1) GDP. The US economy expanded at a 1.5% annualized rate in Q2-2026, down from 2.1% in Q1 (chart). At first glance, the slower growth rate suggests that the economy lost some momentum during the quarter. A closer look suggests otherwise. Underlying demand was quite strong. Final sales to private domestic purchasers, a key measure of underlying demand that excludes volatile trade and inventory swings, rose 3.9%, the strongest increase since Q1-2023 (chart)! Consumer spending increased 3.2%, up from 0.5% in Q1. Nonresidential fixed investments jumped 8.4%.The weakness in headline GDP largely reflected trade, as an 11.5% surge in imports caused net exports to subtract 1.5 percentage points from growth. AI-related imports have been especially strong. The Weekly Economic Index eased to 2.5% for the week ended July 24 but continued to signal a solid start to Q3 economic activity (chart). (2) Inflation. In Q2's GDP report, inflation remained troublesome. The core PCE rose at a 3.4% annualized rate, well above the Fed's 2.0% target (chart). Headline PCED inflation declined 0.1% m/m in June, but was still up 3.7% y/y (chart). The core reading, which excludes volatile food and energy prices, was up 0.1% m/m and 3.3% y/y. The PCED for goods eased to 3.7% y/y in June from 4.0% in May (chart). Much of the moderation reflected a 9.6% m/m drop in gasoline prices. Meanwhile, tariff-related price pressures have yet to fully fade, and the ongoing AI buildout should continue to boost inflation across the technology ecosystem. Together, these forces suggest that goods inflation will remain elevated in the months ahead. The PCED for services eased to 3.7% y/y in June (chart). "Supercore" PCED for services (excluding both energy and housing) edged down to 3.8% y/y (chart). Part of the improvement reflected weakness in volatile categories such as hotel accommodations and nonprofit services. It remains stuck above 3.0%. (3) Consumer spending and income. Americans continue to shop. Real consumer spending rose to another record high in June (chart). Real disposable personal income (DPI) posted its third monthly increase since January. Nevertheless, real DPI has been flat for over a year and should remain so with Baby Boomers continuing to retire. June's saving rate declined to 2.7%, the lowest since 2022 (chart). We expect it will continue to fall as more Baby Boomers retire. They no longer earn labor income, but they are continuing to spend their sizeable net worth. Real consumer spending rose 0.4% m/m in June, lifting the three-month average growth rate to its highest level since August 2025. Gains were broad-based, with particularly strong increases in discretionary categories such as restaurants and hotels, recreation, and apparel (chart). (4) Labor market. Initial unemployment insurance claims rose to 197,000 in the latest week, but the four-week average fell to its lowest level since January 2024. Continuing claims declined for a third straight week. These numbers underscore the labor market's resilience (chart).
On The Semi Slump, Life Insurers & Plastics
Investors have come down hard on the stocks of semiconductor companies over the past two months. Jackie examines their worries about the industry’s outlook. … Also: Is it right for private equity firms to own life insurance companies and invest the insurers’ assets? That’s happening increasingly, yet critics allege that potential conflicts of interest abound that could put insurers in harm’s way. … And: The Gulf war has disrupted the plastics production pipeline, sending the prices of virgin plastic surging at a time when US plastic recycling capacity is way down.
Archive
Our Research Library
19 years of daily research, charts, and analysis
Topics
QuickTakes Topics
Timely commentary covering the most important market themes
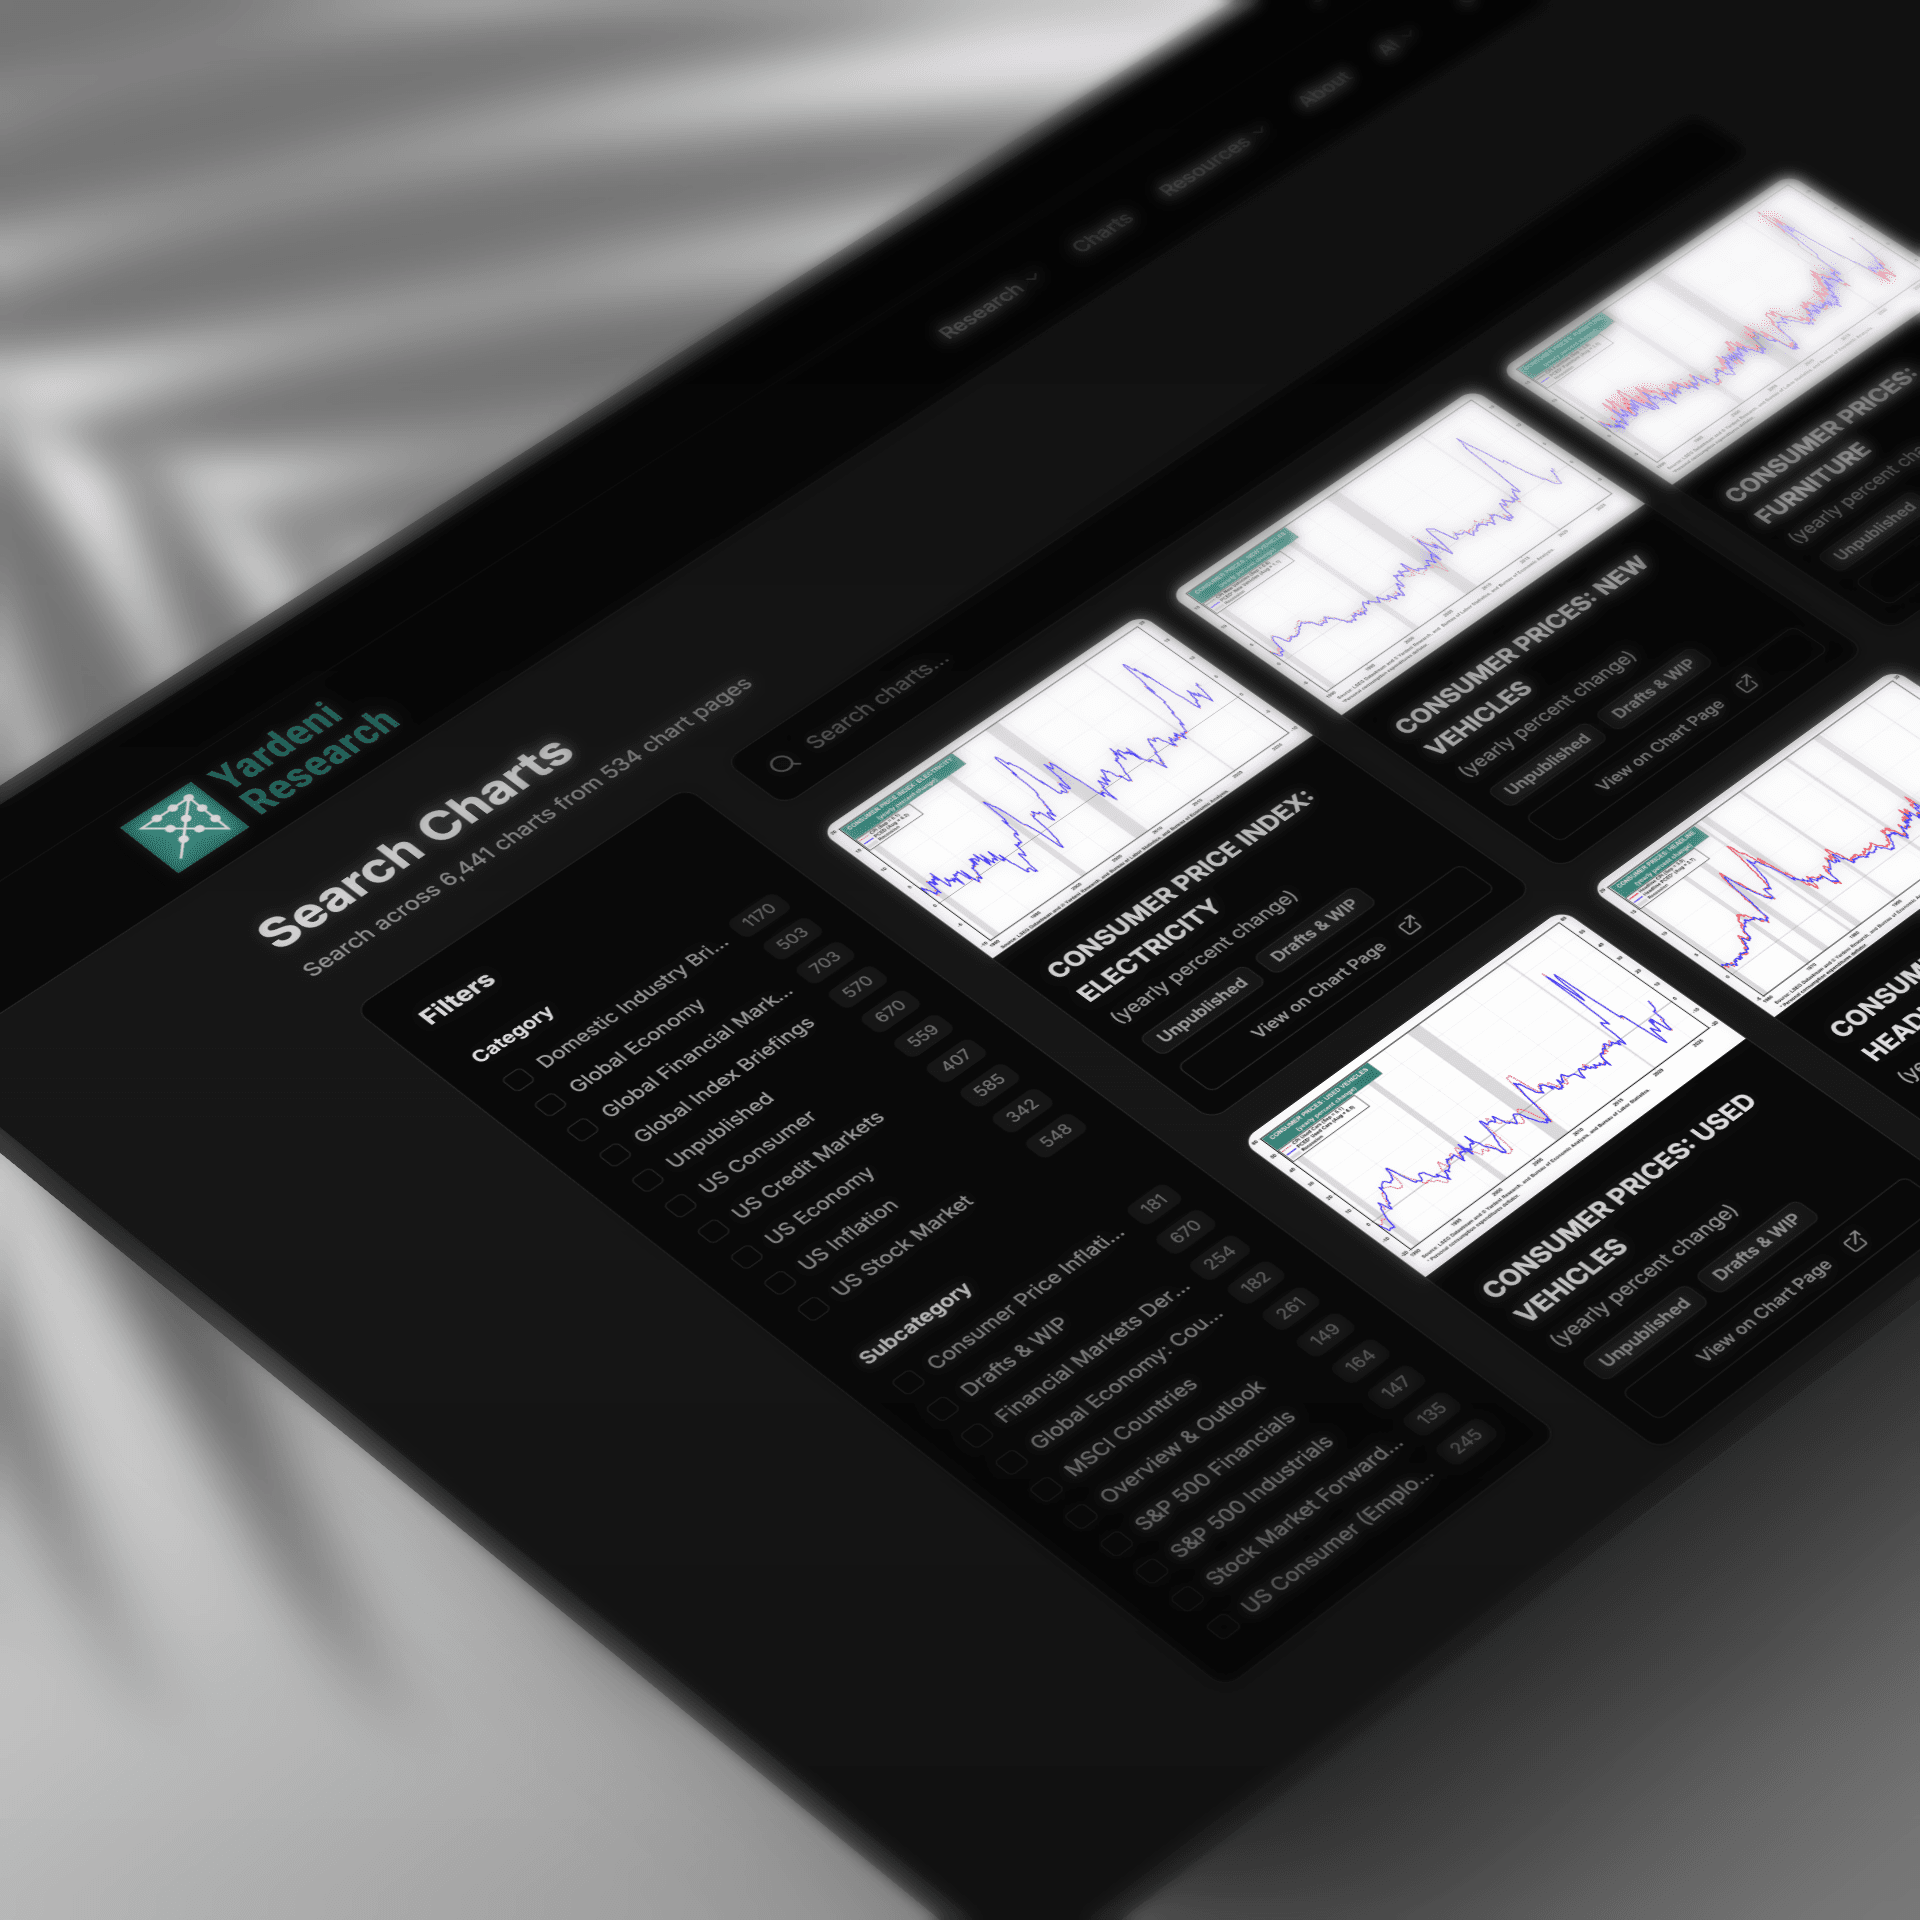
Charts
Find Any Chart in Seconds
Search across 7,533+ real-time charts with instant visual previews
MORGAN STANLEY: FORWARD P/E
NIKE: PRICE, FORWARD EARNINGS & VALUATION
TARGET: STOCK PRICE INDEX, EARNINGS & P/E
CONOCOPHILLIPS: FORWARD LTEG, STRG & STEG
Sample charts from our collection of 7,533+ visualizations
Tools
Research Tools
Interactive dashboards for tracking economic conditions and market trends
Beige Book Monitor
Fed economic conditions across 12 districts with traffic-light signals.
FOMC Policy Meter
Dovish-to-hawkish policy stance tracker across FOMC meetings.
FOMC Minutes Monitor
Hawk/dove signal extraction across 10 economic themes.
FOMC SEP Monitor
Fed projections and dot plot distributions across meetings.
FOMC Statements
Every FOMC policy statement since 1997 — full text, rates, and voting records.
Private Credit Monitor
Auto-updating chronology of the private credit liquidity crisis.
Release Calendar
Major publications from the Fed, ECB, IMF, and 12 global institutions.
Try Yardeni Research free for four weeks.
Full access to everything we publish. No credit card, no obligation.