
Independent Financial Research & Analysis
Daily briefings, 7,700+ real-time charts, and macro insights from Dr. Ed Yardeni and his research team.

Research
Latest Research
Recent insights from our research team
AI Credit Crunch?
I. AI Jitters Investors have worried that AI companies are spending too much on data centers. These companies' once ample free cash flows have turned negative, forcing them to borrow. Concerns have mounted that they are driving up financing costs and won't generate sufficient returns to justify their huge investments. Now, another concern is moving to the forefront: Does enough capital even exist to finance everyone's ambitious AI spending plans? Meta's earnings announcement on Wednesday brought these concerns to the fore. Despite revenues rising 26% y/y to $64.6 billion, the company reported negative free cash flow of $2.1 billion. It raised the lower end of its 2026 capital expenditure guidance to $135–$145 billion and announced a new class of non-voting shares to facilitate future capital raising. Investors interpreted the move as a sign that even hyperscalers may be rushing to secure financing before competitors absorb the available capital. Indeed, the Meta report stated: "Recent significant capital raises from peers like Alphabet and SpaceX, alongside anticipated fundraising from Anthropic and OpenAI, have created an increasingly challenging fundraising environment." Several industry leaders have confirmed this concern. Broadcom CEO Hock Tan recently warned that capital could become the biggest constraint on AI development. BlackRock CEO Larry Fink said that competition for capital was the fiercest he had witnessed in his career. On Thursday, Nvidia CEO Jensen Huang warned that neocloud demand is "off the charts" but capital is scarce. As AI companies compete for capital, rising financing costs increase the returns required to justify investments, amplifying the original worry about whether all that spending will pay off. Today’s market action showed how these concerns are playing out across stock and bond markets: (1) AI stocks got a shellacking. Meta's shares plunged 7.0% today after yesterday's announcement, leading a broad selloff in AI-related stocks. Nvidia fell 4.4%, CoreWeave fell 10.1%, and Lam Research fell 11.8%. SOXX dropped 6.8% (chart). The Nasdaq dropped 2.6%, its worst day in four months (chart). (2) Investors rotated. The market broadened away from technology stocks today. The equal-weighted S&P 500 edged up 0.7%, outperforming its market-cap-weighted counterpart, which fell 1.2% (chart). MAGS fell 3.4% today, while XMAG edged down 0.5% (chart). The latter is still outperforming the former so far this year: 14.3% versus 10.5%. The Dow edged up 0.02%, while the Russell 2000 gained 0.11% (chart). Rather than abandoning equities, investors rotated away from the AI trade into other sectors. (3) The bond market's reaction was a happy one. Treasury yields declined across the yield curve, with the 2-year falling sharply to 4.64% but remaining well above the effective federal funds rate (chart). The 10-year Treasury yield fell below 5.00% for the first time in nearly a month, returning to what we consider its old-normal range of 4.00%–5.00% (chart). The Treasury market rally suggests that investors are increasingly concerned that tightening access to capital could slow the AI buildout, one of the economy's most important growth engines. (4) Our take. We view market-driven tightening access to capital as healthy for the AI boom, resulting in more efficient capital allocation and reducing over-investment risks. Importantly, we expect the key players to retain financing access. The five major hyperscalers (Amazon, Alphabet, Meta, Microsoft, and Oracle) alone are projected to spend almost $780 billion in 2026. Over each of the following four years, from 2027 through 2030, that figure is expected to exceed $1 trillion annually. Their strong cash flows, balance sheets, and market access should allow them to continue investing in AI. II. The Middle East Wild Card Another development amplifying risk-off sentiment today was escalating geopolitical tensions in the Middle East. The New York Times reported that the US and Israel have developed plans for possible renewed strikes against Iran following the November 3 midterm elections. Meanwhile, intensifying Houthi attacks on Saudi infrastructure prompted the US to order nonessential diplomatic personnel and their families to leave Saudi Arabia, while Saudi Aramco evacuated staff from its Dhahran headquarters. The price of Brent crude oil jumped to $113.17 per barrel Thursday, while West Texas Intermediate crude rose to $103.95 (chart). That sent XLE, which we've recommended overweighting, to a new record high today. Yet, Kpler data cited by The Wall Street Journal showed Middle Eastern oil exports averaging more than 24 million barrels per day during the week through October 18, exceeding prewar levels of 23 million. Prices remain elevated partly because of higher shipping costs, but more importantly because of a geopolitical risk premium, reflecting concerns that such flows may not be sustained. The bottom line is that the Middle East conflict remains a wild card. However, we expect US consumer spending and business investment to remain robust, while federal deficits of roughly 6% of GDP (during a solid economic expansion) provide additional economic stimulus. We expect the US economy will continue to pass the latest stress tests originating in the AI ecosystem and in the Middle East. III. Miscellaneous We expect to see lower bull-bear ratios next week after today's drubbing (chart). If they fall low enough, that might set the stage for a year-end rally. Then again, there might be a better opportunity to buy the dip when and if bombs start falling again in the Middle East. Gold sold off on today's commotion even though interest rates fell (chart). We are expecting that the retest of $4,000 per ounce might hold and be a good entry point following this year's correction (chart).
Europe’s Future
Five Central and Eastern European countries are enjoying an economic renaissance—expanding exports, growing GDP at rapid clips, and attracting foreign investment. William argues that investors seeking the next great European growth story need look no further than the de facto bloc of Poland, Romania, the Czech Republic, Hungary, and Slovakia. … Europe has been gaining relevance in the global economy by investing in strategically indispensable sectors: defense and aerospace, energy infrastructure, semiconductors, critical minerals, batteries, AI innovation, and digital infrastructure. But retooling Europe is expensive. Can Europe pay for its new relevance without reviving its old fiscal crises? France is the first test.
Irrational Exuberance In S&P 500 FEMO?
Are analysts' earnings expectations for the S&P 500 irrationally exuberant? So far this year, FEMO (fabulous earnings momentum, as measured by actual earnings per share) has been soaring, while FOMO (fear of missing out, as reflected in P/E multiples) has been mostly retreating. Much of that earnings optimism is concentrated in the S&P 500 Information Technology sector, particularly the Semiconductors industry, where the AI investment boom has fueled extraordinary demand, pricing power, and profit margins. But can these conditions persist? Let's take a closer look: (1) FEMO overwhelming FOMO. The S&P 500 is up 13.3% ytd, despite a 13.5% contraction in its forward P/E. That's because FEMO has overwhelmed waning FOMO, with forward earnings jumping 31.0% since the start of the year (chart). The divergence is even more striking in Information Technology. The sector's forward earnings has soared 65.5% ytd, while its forward P/E has plunged 25.9%. The S&P 500 IT stock price index has risen 22.6% ytd, powered by FEMO (chart). Industry analysts remain remarkably bullish on the S&P 500's fundamentals. Forward revenues is up 15.7% y/y, while forward earnings is up 39.0% (chart). (2) Semiconductors driving FEMO. Much of that optimism originates in the IT sector, where forward revenues and earnings are up 57.2% and 91.4% y/y, respectively (chart). Digging deeper reveals that the sector's extraordinary FEMO originates largely in the Semiconductors industry, where forward revenues and earnings are up 121.7% and 176.0% y/y, respectively (chart). Indeed, semiconductors now account for a record 55.0% of the IT sector's forward earnings and 40.9% of its market capitalization (chart). The growing importance of semiconductors extends to the broader market. Semiconductors now account for a record 20.4% of the S&P 500’s forward earnings and 15.8% of its market capitalization (chart). That makes the industry's earnings trajectory increasingly important for the entire index. Analysts expect Semiconductor revenues and earnings to grow 61.3% and 74.0% over the next year, respectively. More remarkably, they expect earnings growth to average 66.1% annually over the next five years. These extraordinary expectations help explain why analysts project IT sector earnings growth of 44.8% over the next year and 42.0% annually over the next five years (chart). In turn, analysts expect S&P 500 earnings to grow 19.0% over the next year and an average of 26.1% annually over the next five years, the latter approaching a record high. (3) Pricing power fueling Semiconductors' FEMO. To determine whether S&P 500 FEMO shows irrational exuberance, we need to assess whether Semiconductor FEMO does so. Much of the industry's extraordinary earnings growth reflects unprecedented profit margin expansion. The industry’s forward profit margin nearly doubled from the 2023 lows to a record 51.8% during the week of October 20 (chart). The explanation is straightforward: Demand for chips has surged as hyperscalers and neocloud providers have raced to build AI infrastructure, while supply is capacity constrained. The resulting pricing pressures are clearly evident in the PPI for electronic components & accessories (up 26.8% y/y through September) and the import price index for computer & electronic product manufacturing (up 12.4% y/y through September) (chart). (4) Will Semiconductors' pricing power persist? That's the critical question for assessing whether Semiconductor FEMO is irrationally exuberant. Investors already seem skeptical. The Semiconductor industry's forward P/E has plunged to just 14.2 despite surging earnings expectations (chart). In other words, unlike the tech bubble of 1999, any irrational exuberance in FEMO has been mostly offset by depressed FOMO! The goods news is that demand for chips should remain strong. The nine largest cloud service providers are expected to spend $957 billion on capex this year, up 106% y/y, and more than $1.5 trillion in 2027. But supply is starting to catch up. Global semiconductor manufacturing capacity is expected to expand 5% this year and another 6% in 2027, potentially easing shortages and price pressures. (5) Irrational earnings exuberance? We suspect there is some irrational exuberance in Semiconductor FEMO, particularly in analysts' consensus long-term earnings growth expectations. Today's demand-supply imbalance supports extraordinary profits, but sustaining current pricing power and margins over a longer time horizon seems optimistic as capacity expands. With Semiconductors accounting for more than one-fifth of S&P 500 forward earnings, that exuberance is reflected in the broader index. Nevertheless, FEMO remains robust beyond Semiconductors. Analysts expect Q3 earnings growth of 30.7% y/y, with positive growth across all 11 sectors (chart). Our diffusion indexes also show that an increasing share of S&P 500 companies is experiencing rising forward revenues and earnings (chart). Combined with expectations that semiconductor demand will continue to outpace supply, at least over the near term, this suggests that FEMO remains fundamentally rational.
Archive
Our Research Library
19 years of daily research, charts, and analysis
Topics
QuickTakes Topics
Timely commentary covering the most important market themes
Charts
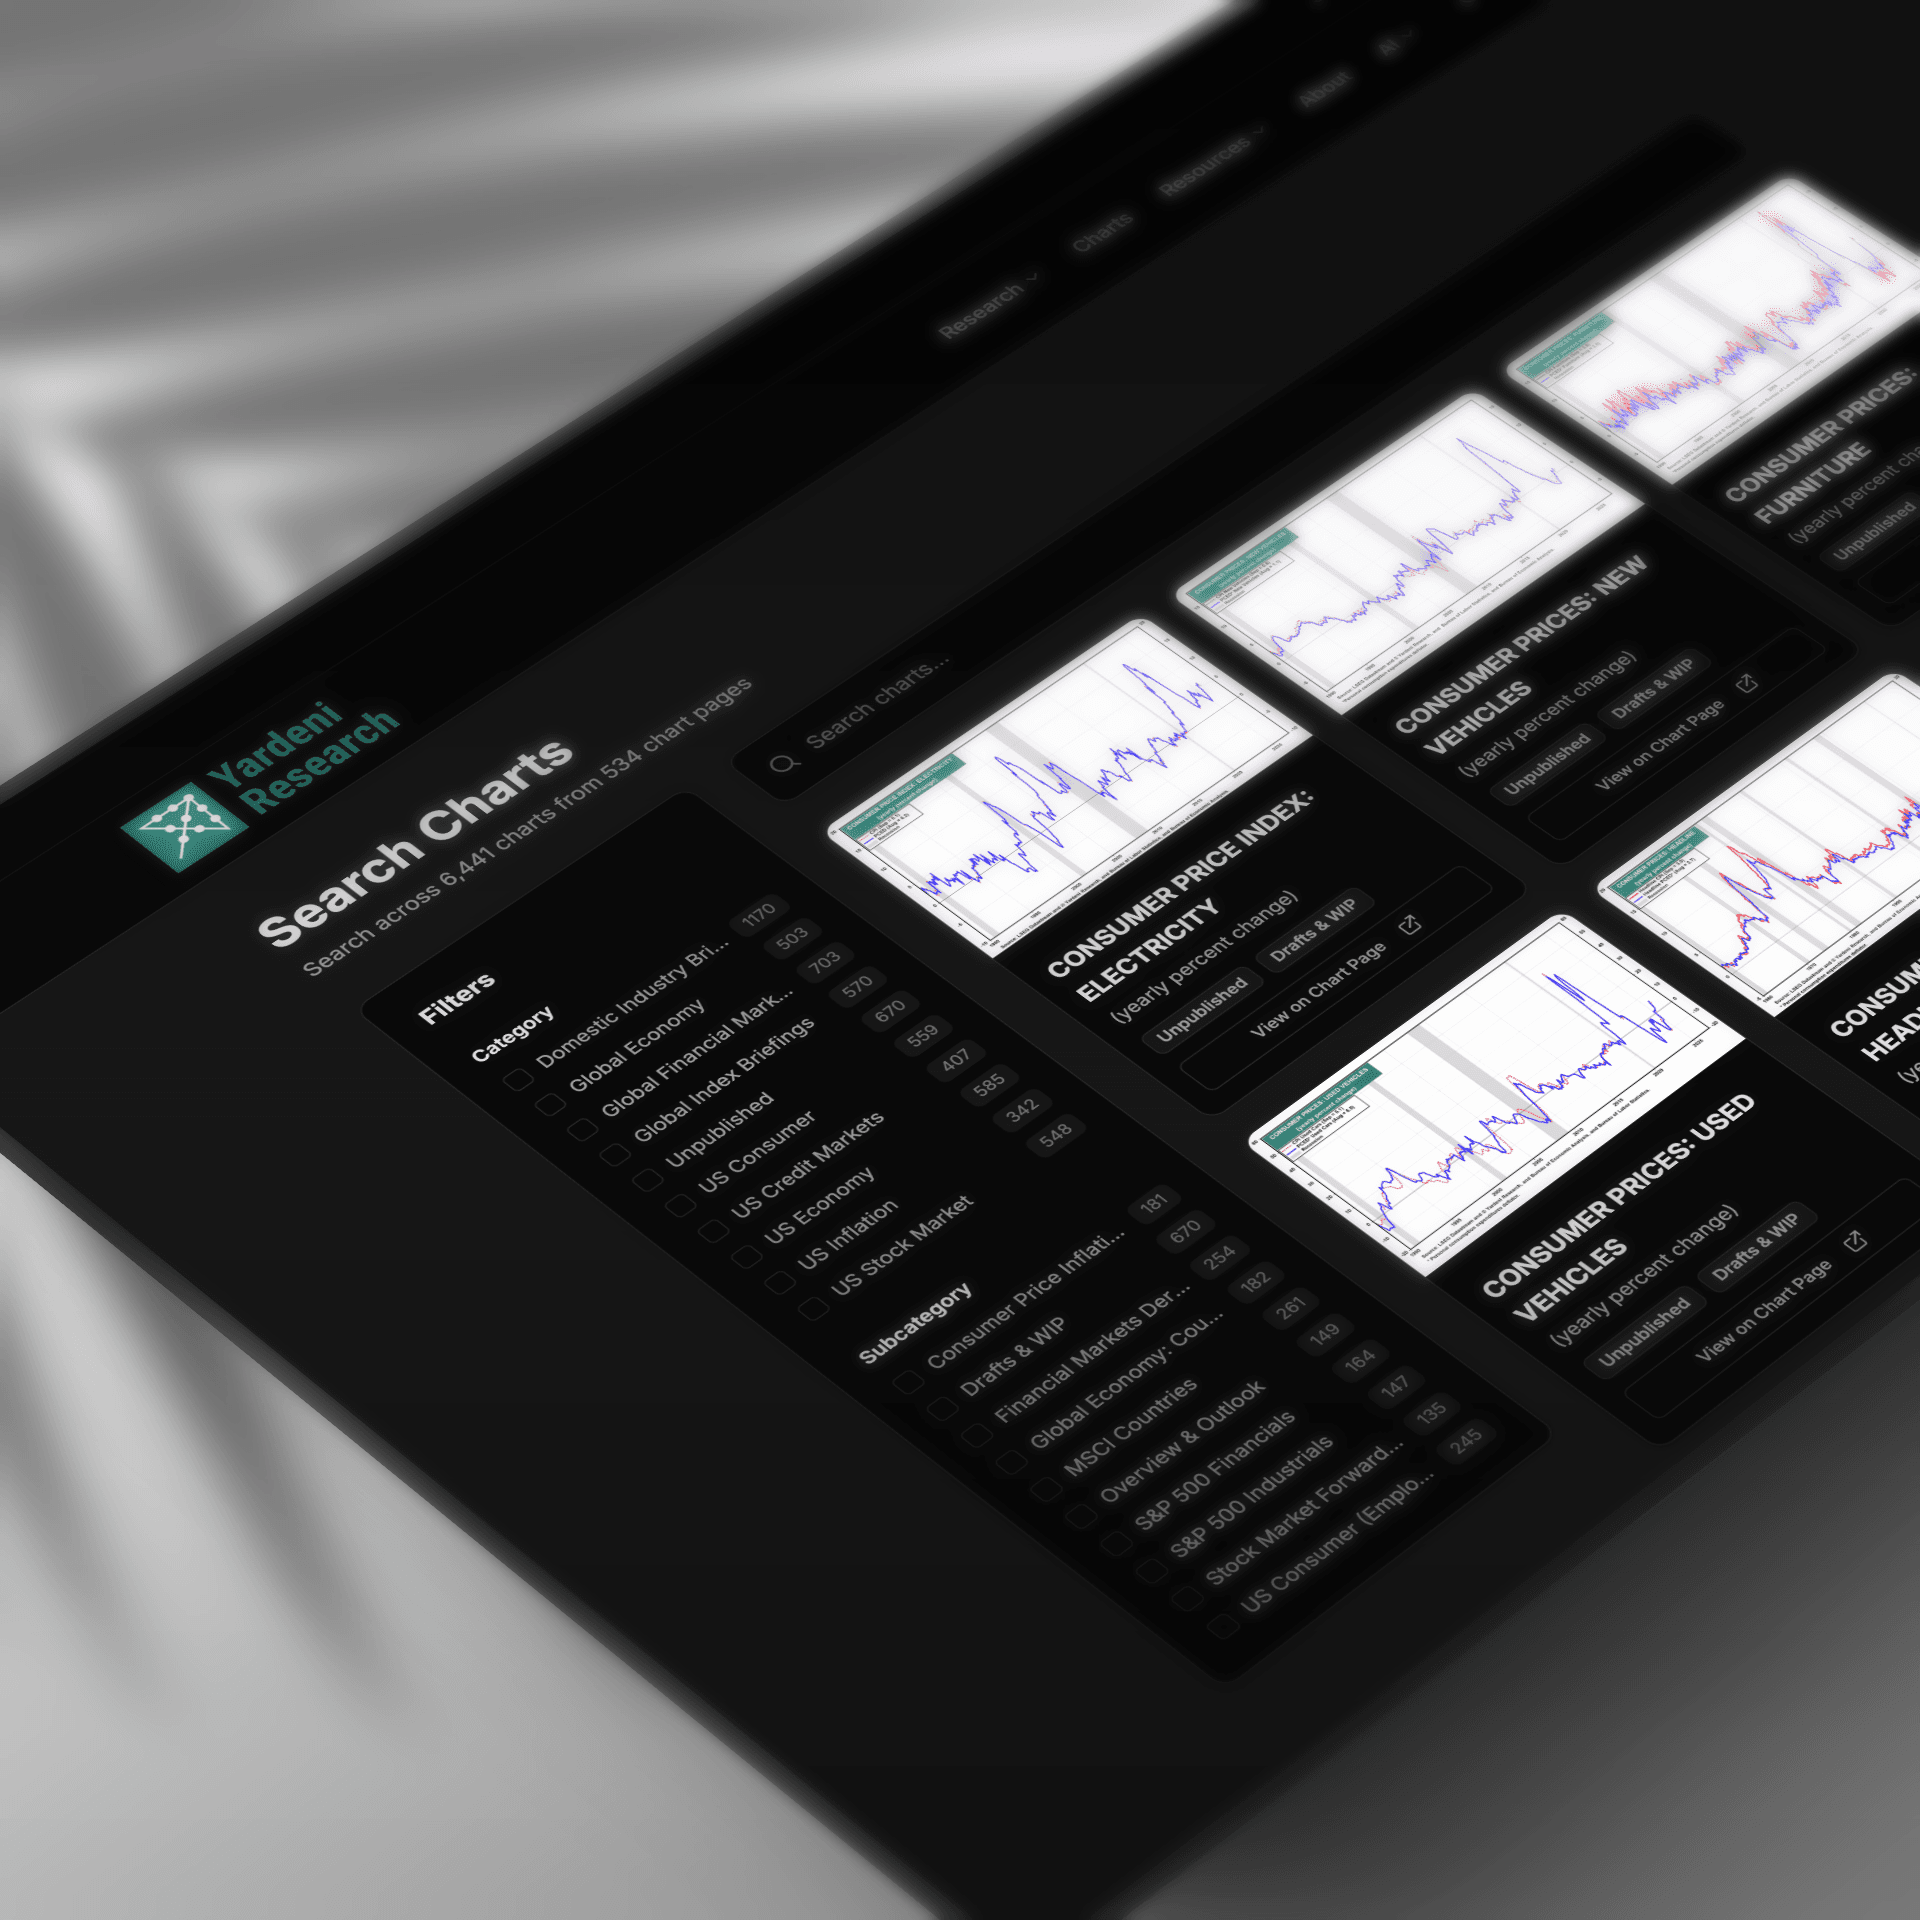
Find Any Chart in Seconds
Search across 7,760+ real-time charts with instant visual previews
BNY MELLON: FORWARD PROFIT MARGIN
TARGET: FORWARD P/E
S&P 500 CONSUMER DISCRETIONARY SECTOR & INDUSTRIES: ANNUAL EARNING GROWTH FORECAST
GENERAL MOTORS: FORWARD P/E
Sample charts from our collection of 7,760+ visualizations
Tools
Research Tools
Interactive dashboards for tracking economic conditions and market trends
Beige Book Monitor
Fed economic conditions across 12 districts with traffic-light signals.
FOMC Policy Meter
Dovish-to-hawkish policy stance tracker across FOMC meetings.
FOMC Minutes Monitor
Hawk/dove signal extraction across 10 economic themes.
FOMC SEP Monitor
Fed projections and dot plot distributions across meetings.
FOMC Statements
Every FOMC policy statement since 1997 — full text, rates, and voting records.
Private Credit Monitor
Auto-updating chronology of the private credit liquidity crisis.
Release Calendar
Major publications from the Fed, ECB, IMF, and 12 global institutions.
Try Yardeni Research free for four weeks.
Full access to everything we publish. No credit card, no obligation.